Should I buy or sell Apple Stock?

Quiz!

What is the impact of Apple’s share buybacks on its P/E, and should you adjust for it?

  1. The share buybacks lowered Apple’s P/E in the past 3 years. At this rate, Apple’s cash will be gone in less than 3 years. Since this is not sustainable, you should adjust for it.
  2. Apple is a highly profitable company with desirable products. Its profits should keep generating cash to support share buybacks for the long run. There is no need for adjustments.

Should I buy or sell Apple Stock?

Apple is a very successful company, with strong demand for their products.  As an investment, I see conflicting messages in their financials:

  1. The Price/Earnings (P/E) of 21 is not extremely high (https://www.macrotrends.net/stocks/charts/AAPL/apple/pe-ratio).
  2. The Price/Book (P/B) of 41 is stratospheric, about x20 higher than the average for the S&P 500 (https://www.macrotrends.net/stocks/charts/AAPL/apple/price-book).

The problem?  Apple did massive share buybacks, reducing its cash on hand by 55% within about 3 years (https://www.macrotrends.net/stocks/charts/AAPL/apple/cash-on-hand).  Share buybacks reduce the number of shares, increasing the earnings per share, and lowering the P/E.  At the current rate, Apple’s excess cash will go down to $0 in less than 3 years.  Assuming continued success, with no change in earnings growth, something has to give within the next 3 years: a drop in the stock price, or a big increase in the P/E, resolving some of the current anomaly.

The solution? You can estimate the annual impact of share buybacks on Apple’s P/E in the past 3 years, and adjust for it, as part of a full analysis of the stock. QAM focuses on value investing based on the more reliable, stable and thoroughly studied P/B, and diversifies stock portfolios into 1,000s of stocks.

Quiz Answer:

What is the impact of Apple’s share buybacks on its P/E, and should you adjust for it?

  1. The share buybacks lowered Apple’s P/E in the past 3 years. At this rate, Apple’s cash will be gone in less than 3 years. Since this is not sustainable, you should adjust for it. [Correct Answer]
  2. Apple is a highly profitable company with desirable products. Its profits should keep generating cash to support share buybacks for the long run. There is no need for adjustments.

Explanations:

  1. Please read this month’s article above for an explanation of this point.
  2. While Apple is profitable, a realistic valuation should reflect a sustainable future, including a stable level of cash. With cash dropping fast in recent years, an adjustment is needed.
Disclosures Including Backtested Performance Data

A Hidden Measure of Investment Risk, Beyond Volatility

Quiz!

Which is a riskier situation?

  1. 1M invested in a stable investment that grows by 5% per year and never declines.
  2. 3M invested in a highly volatile investment that grows by an average of 8% per year and suffers significant frequent declines of up to 60% from the peak.

A Hidden Measure of Investment Risk, Beyond Volatility

This article debunks a conventional wisdom that equates volatility with risk, and ignores all other factors. The following example demonstrates a problem with this narrow focus. Compare the following two situations:

  1. 1M invested in a stable investment that grows by 5% per year and never declines.
  2. 3M invested in a highly volatile investment that grows by an average of 8% per year and suffers significant frequent declines of up to 60% from the peak.

By focusing on volatility alone, you would conclude that the first investment is less risky. This conclusion is wrong. The lowest balance that the stable investment can reach is 1M, since it never declines. The lowest balance that the volatile investment can reach is 1.2M, since it starts with 3M and can go down by up to 60% of the peak. The first investment is riskier for two reasons: (1) it grows more slowly on average, and (2) it has a lower worst-case balance. Your risk of running out of money with this investment is greater.

Since the starting investment amounts are different in the two cases, how can this apply to the real world? An example could help:

  1. Say you have 1M invested in a stable investment.
  2. The investments grow to 1.1M through a combination of investment growth and new savings. This allows you to shift your investments towards higher expected growth along with higher volatility. Specifically, the investments can potentially decline by another 100k (10%) during declines, to get you to the prior risk during declines.
  3. You repeat the step above, leading to higher and higher expected growth, while keeping the risk level the same.
  4. Your investments reach 2.5M, and you reached an allocation for maximum potential growth, along with potential declines of up to 60%. Your risk level is still the same with the lowest balance being: 2.5M x (1 – 60%) = 1M.
  5. Your investments reach 3M, and you keep the allocation the same, since you already enjoy the maximum potential growth. But now the lowest your investments can reach is up to 3M x (1 – 60%) = 1.2M, giving you higher security, despite the much higher volatility.

Notes:

  1. Risk is determined by spending/investments, not investments alone. To account for expenses going up or down, you should track spending/investments, not just the investment balance.
  2. Another risk factor is the valuations (P/B = Price/Book, or price relative to intrinsic value or liquidation value). In diversified portfolios, high valuations lead to higher risk (greater potential decline), and lower valuations lead to lower risk (lower potential decline).
  3. Some stable investments are exposed to inflation risk, making them riskier than seems.  On the other hand, there is no guaranteed maximum decline for any investment.  It is all a matter of odds.
  4. If higher volatility leads you to panic and sell low, that is another risk factor that can take away the financial benefits described above.
  5. While income from work can be lost at any point, some jobs are much more secure than typical (e.g. doctors), and can help your risk profile.

Implications:

  1. A plan that may be risky for someone else, may be conservative for you (and vice-versa), depending on your respective ratios of expenses/investments & valuations.
  2. A plan that would have been risky for you a few years ago, may be conservative for you today (and the reverse is potentially true if your expenses grow faster than your investments).

Quiz Answer:

Which is a riskier situation?

  1. 1M invested in a stable investment that grows by 5% per year and never declines. [Correct Answer]
  2. 3M invested in a highly volatile investment that grows by an average of 8% per year and suffers significant frequent declines of up to 60% from the peak.

Explanation: See article for explanations.

Disclosures Including Backtested Performance Data

5 Rules of Thumb to Avoid Making a Painful Investment Change

Quiz!

Which are good ways to reduce your risk after 10 years of poor returns for a diversified investment? (There may be multiple answers.)

  1. Diversify and include some lower risk investments that performed well in the past 10 years.
  2. Lower your risk by holding some bonds.
  3. Lower your risk by holding some cash.
  4. Don’t make any change.
  5. Increase your allocation to the investment.

5 Rules of Thumb to Avoid Making a Painful Investment Change

Have you ever seen your diversified investments perform poorly for an extended period of 5-10 years, and felt that it would be prudent to diversify to reduce your risks? Have you moved money to an investment that felt much safer based on those years? In most cases, such activity would increase your risk – the opposite of your intended action. In some cases, the results could be painful.

How can a shift to reduce risk end up being painful? Diversified investments tend to be cyclical. The risk of a tough decade following a tough decade is lower than typical, not higher. Furthermore, the risk of a tough decade after an exceptional decade is higher than typical. Here is a case that may be familiar to you: In the late 1990’s US Large Growth stocks seemed like the safest stocks in the world. A switch to these seemingly safe stocks could have led you to losing 30% of your money over the following 10 years (total returns, including dividends, starting 3/1999). If you would have switched away from the seemingly risky Value or Emerging Markets stocks, your pain would have compounded, by missing phenomenal growth.

How can you avoid making a flawed change? Here are a few rules of thumb:

  1. Compare your investment performance in the past 10 years to the long-term performance (ideally 30+ years). If the past 10 years were below average, the investment is likely to be less risky than usual, not more. Don’t make a change!
  2. Do the same for the target investment you want to diversify into. If the past 10 years were above average, the investment is likely to be more risky than usual, not less. Don’t make a change!
  3. Do the same when comparing valuations, as presented by Price/Book. If the change would increase your Price/Book, you would sell low and buy high, something that can hurt you.
  4. Imagine living through a period with the opposite recent performance – would you still feel that you are reducing your risk with the intended change? If not, the alarm bells should be ringing.
  5. Say that someone urges you to diversify your portfolio, given the risk of your current portfolio, as presented by recent performance. Check how diversified your current portfolio is. If it includes 100’s or 1,000’s of stocks, split over many sectors in many countries, you are probably already diversified. The phrase: “You should diversify”, is a disguise for the real intent: “You should buy the recent winners, no matter what it does to your diversification.”

How can you use the information above today?

  1. Just like in the 1990’s, US Large Growth stocks performed far better than their long-term average. They averaged about 13% per year over 10 years, compared to a 10% long-term average. You should realistically expect the returns in the next 10 years to be much lower, not just below 13%, but far below 10%. In addition, the P/B of these stocks is far above average, another warning sign for poor upcoming returns.
  2. The reverse is true for Emerging Markets stocks. They grew far below their average. For example, the portfolio Extended-Term Component grew by a mere 2% per year in the past 10 years, compared to 9.3% 22-year average. In addition, the valuations of this portfolio are far below average. Returns above the 9.3% average in the next 10 years are the likely outcome.

A few words of caution: cycles don’t have a fixed length. Returns that are better or worse than average can continue longer or shorter than expected. In addition, long-term averages can fluctuate. While no result is guaranteed, the information above can help you work with the odds, and not against them.

Quiz Answer:

Which are good ways to reduce your risk after 10 years of poor returns for a diversified investment? (There may be multiple answers.)

  1. Diversify and include some lower risk investments that performed unusually well in the past 10 years.
  2. Lower your risk by holding some bonds.
  3. Lower your risk by holding some cash.
  4. Don’t make any change.
  5. Increase your allocation to the investment. [Correct Answer]

Explanations:

  1. Answers 1-3: Diversified investments tend to be cyclical – selling after 10 tough years, is likely selling low. Buying an investment that performed unusually well at the same time, is likely buying high. This will likely increase your risk.
  2. Answer 4: While future returns are likely to be above average, and risks below average, no change will keep your risk profile at the same reduced level.
  3. Answer 5: Buying extra at a very low point may reduce your risk, if valuations (Price/Book) are far below average and the investment is diversified.
Disclosures Including Backtested Performance Data

Warren Buffett’s Strategy vs. Quality Asset Management’s

Quiz!

Which of the following are common to Warren Buffett and Quality Asset Management?

  1. Value investing
  2. Home bias
  3. Profitability bias
  4. Reduced volatility

Warren Buffett’s Strategy vs. Quality Asset Management’s

Warren Buffet is one of the greatest investors of all times. Given that his fund, Berkshire Hathaway, holds a small number of stocks, you may think that his strong performance was the result of superior stock selection (a.k.a. alpha). A study that was published in 2013 (https://www.nber.org/papers/w19681) found that the benefit of his stock selection was statistically insignificant, attributing virtually the entire performance to structural decisions. Below I review the sources of his performance that are in common with Quality Asset Management (QAM), and those that are different.

In common:

  1. Value: Both invest in companies with a low price relative to the company’s book value (low P/B).
  2. Quality: Both invest in profitable companies.
  3. Reduced Volatility: Buffett buys low volatility stocks that historically resulted in excess returns. QAM achieves similar results (reduced volatility, excess returns) by excluding extremely small and expensive (high P/B) stocks as well as stocks experiencing negative momentum.

Buffett’s benefits:

  1. Leverage: Buffett employs leverage of 1.4 to 1.6, with very low costs of borrowing thanks to using capital from his insurance business (premiums received until claims where paid), and interest-free loans: differed tax on depreciation, accounts payable and option contract liabilities. QAM helps clients use home mortgages & HELOCs (home equity lines of credit) to generate leverage, when desired, possible (the client can qualify for the loans) & subject to a risk analysis. In addition, it invests deferred obligations, including income taxes until due (e.g. when the client pays 110% of past year’s taxes in estimated taxes, and enjoys faster growing income). QAM uses very low cost margin for loans backed by unused HELOCs, and other sources. While there are some similarities, this strategy is not used for all of QAM’s client’s, and the leverage level declines with the growth of the portfolio relative to the client’s home value. In addition, the interest rate that Buffett gets from his insurance arm is lower than the interest rates that QAM’s clients get. Therefore, this is usually a benefit to Buffett relative to QAM.

QAM’s benefits:

  1. Size: Early on, Buffett focused on small companies. Given the size of his fund, he cannot practically focus on a small number of small companies, and he developed a bias towards large companies. QAM has a bias towards small companies that is likely generate a return premium relative to Buffett. This benefit is likely to be sustainable for a very long time, given QAM’s strong diversification.
  2. Country: Buffett has a bias towards American companies. QAM doesn’t have this bias, and it focuses on companies from less developed countries. This is likely to generate a return premium.

Quiz Answer:

Which of the following are common to Warren Buffett and Quality Asset Management?

  1. Value investing [Correct Answer]
  2. Home bias
  3. Profitability bias [Correct Answer]
  4. Reduced volatility [Correct Answer]

Explanations: Please read the article above for explanations.

Disclosures Including Backtested Performance Data

Outpacing the Longevity Escape Velocity

Quiz!

If you are retired, can stick to an investment plan, and spend 3%-4% of your money per year, which of the following are important for handling your biggest risks (any number of answers may be correct):

  1. Limiting yourself to fast growing investments.
  2. Picking the right stocks, to avoid big losses.
  3. Diversifying into various asset types, including stocks, bonds & real estate.
  4. Staying disciplined with your plan, and avoiding panic sales.

Outpacing the Longevity Escape Velocity

Ray Kurzweil, director of engineering at Google & inventor, predicts that in 10-12 years we will reach longevity escape velocity. This is the point when science and technology will add more than a year to our lifespan for every year we remain alive, leading to an infinite life. With an 86% accuracy rate for his prior predictions about the future, there is some chance that this will be true as well. He may be almost completely wrong, with a lifespan of a mere 200 years or 2,000 years, instead of infinity. When planning my investments, I wouldn’t bet with 100% confidence that he is completely wrong, especially when losing the bet would mean spending most of my long life broke.

Unfortunately, many retirement plans do make this bet. A retirement plan with a 95% chance of providing 30 years of retirement income is typically considered appealing. That means a 1-in-20 (5%) chance that if you live for 30 years, you will go broke later in life, just when financial stress is the toughest to handle. If you live longer than 30 years, the odds of failure go up. I have personally known a retired woman that gradually depleted her assets, and faced one of two tough cases: dying soon or going broke. This memory is carved in my mind, and I am not ready to see any of my clients reach the same position.

Accepting some chance of an infinite life, or simply a very long one, requires infinite income. While the word infinite sounds dramatic, it is not impossible to plan for infinite income with very high odds. You simply need to apply a similar principle of escape velocity to your investments, with more growth than spending, in an average year. Stable investments (bonds, money market) grow too slow to support long-lasting withdrawals that accelerate with inflation. So, we need to seek faster growing investments, and handle the volatility, by accounting for withdrawals during downturns. By using investments that grow fast enough, you can make up for the penalty of withdrawals during declines, as long as the investments are diversified, and the withdrawal rate is low enough. Two stock portfolios fit the requirements:

  1. Long-Term Component (LT) is likely to support 4% withdrawals forever.
  2. Extended-Term Component (ET) is likely to support 3% withdrawals forever.

For the disciplined investor with low withdrawal rates, longevity risk turns some common risk-planning principles on their heads: bonds and cash become risky, and diversified stocks become safe! This is because running out of money becomes a greater risk than losing it all during a temporary decline (through small withdrawals).

Once your withdrawal rates from these portfolios go below the stated rates, you would likely reach escape velocity, providing you with income for as long as you live, even infinitely. But instead of just solving the longevity financial risk, you get a big bonus. After reaching a sustainable withdrawal rate, your portfolio is expected to keep growing over full cycles despite your withdrawals. You can choose between higher security or higher income (or some of each) with every new peak.

My clients tend to be conservative, and don’t count on any specific limited lifespan. I tend to reject more aggressive investors.

Quiz Answer

If you are retired, can stick to an investment plan, and spend 3%-4% of your money per year, which of the following are important for handling the biggest risks you may face (any number of answers may be correct):

  1. Limiting yourself to fast growing investments. [The Correct Answer]
  2. Picking the right stocks, to avoid big losses.
  3. Diversifying into various asset types, including bonds, stocks & real estate.
  4. Staying disciplined with your plan, and avoiding panic sales. [The Correct Answer]

Explanations:

  1. If you end up living a long life, you need high enough growth to support annual withdrawals that grow with inflation. With low growth, you can run out of money.
  2. Trying to pick the right stocks introduces the risk of picking the wrong ones – this is a big risk to take when your lifelong income depends on it.
  3. Low-volatility investments are necessary for high withdrawal rates for a short horizon, and for people who panic during stock declines. You have the benefit of discipline and low withdrawal rates, and may face a long horizon.
  4. It is critical to stay disciplined with your plan, and avoid panic sales. A couple of panic sales can negate the entire benefit of the high average gains.
Disclosures Including Backtested Performance Data

Insurance vs. Diversified Stocks

Quiz!

Which of the following is typically true?

  1. It is best to buy insurance for most risks for peace of mind.
  2. It is best to avoid insurance and invest money in stocks, because stocks grow fast and can be used to cover the otherwise insured risks.
  3. It is best to insure against devastating risks.
  4. It is best to insure against non-devastating risks, and buy stocks to handle devastating risks.

Insurance vs. Diversified Stocks

The table below presents a basic comparison between diversified stocks and insurance. The first two rows show similar benefits, while the remaining rows show where each approach shines.

Topic Diversified Stocks Insurance Comments
Distribute risk at any point The growth of 1,000 stocks overshadows one company’s bankruptcy. By pooling 1,000 homeowners, the premiums paid cover the cost of one flooded house. Both help diversify risks at a given instant.
Distribute risk over time The growth of stocks over a full cycle overshadows the decline periods within the cycle. The premiums paid by a large group of homeowners over time cover hurricane damages to a large group of homeowners. Both help diversify risks over time.
Devastating risks House burns down without big money saved => bankruptcy. House burns down => covered by insurance. Insurance is critical for covering risks that would devastate you.
Non-devastating risks Can sell from stocks to cover the low risks. Otherwise, the saved insurance premiums that are invested in stocks are likely to grow dramatically over a lifetime. The insurance premiums are lost. Stocks are typically more beneficial for risks that are not devastating.
Availability The money is available for you at all times, without being at the mercy of an insurance company, but the value will be lower during stock declines. Claims can be declined for various reasons. Insurance: Read carefully the exclusions list for insurance, and have money set aside for declined claims.
Stocks: Have plenty more than the self-insured amounts, to account for stock declines.
Negotiated pricing Not applicable This applies for some types of insurance. Health insurers negotiate lower prices. You get negotiated healthcare costs even with high deductible health insurance, in case this item tips the scale for you.
Risk of under-treatment Risk of avoiding treatment that would otherwise be covered by insurance. Having low-deductible health insurance can encourage treating high-risk problems that seem minor at first If choosing self-insurance using stocks (e.g. by having high-deductible health insurance), be careful to not avoid necessary treatments that you would get with low-deductible insurance.
Overhead No overhead Insurance involves administrative costs and profits to the health insurer, that you pay for. Unless you are a high risk person for using the insurance, your overall average cost may be higher with insurance.

Quiz Answer:

Which of the following is typically true?

  1. It is best to buy insurance for most risks for peace of mind.
  2. It is best to avoid insurance and invest money in stocks, because stocks grow fast and can be used to cover the otherwise insured risks.
  3. It is best to insure against devastating risks. [The Correct Answer]
  4. It is best to insure against non-devastating risks, and buy stocks to handle devastating risks.

Explanations: Read the article for explanations.

Disclosures Including Backtested Performance Data

Growing College Savings Fast Despite the Short Horizon

Quiz!

What is the most powerful way to maximize the value of college savings?

  1. Include increasing amounts of bonds and cash, reaching 100% as your child reaches 18, to minimize the chance of losses due to stock declines.
  2. Maximize 529 plan contributions – while returns are unknown, tax savings are a guarantee.
  3. Allocate 100% of the savings to stocks, and be prepared to take temporary student loans in case of a stock decline during college years.
  4. Create a balanced allocation of stocks & bonds, while maximizing the tax benefits of college saving plans, including both 529 & Coverdell ESA.

Look for the answer below.

Growing College Savings Fast Despite the Short Horizon

Problem: Saving for college involves a tough combination:

  1. College costs are high and grow fast (over 5% historically), requiring the help of a fast growing investment such as stocks.
  2. The time horizon is limited and fixed at 18 years, making the volatility of a stock allocation problematic in the later years. Imagine a stock allocation in 2008 right as your child reaches college age.

Solution:

  1. Invest 100% in stocks, if you (or your advisor) can stay disciplined through tough market downturns, and as long as you have strong stock-, sector- and country-diversification. Otherwise, include as many bonds & cash as needed for you to be able to stick to your plan through declines such as 2008.
  2. Once you reach college years, if there is no major decline, you can sell from your college savings, and enjoy the high likely average growth.
  3. If there is a major decline during college, you can take a student loan. This stretches the expense and lowers your yearly cash outlay during the decline. Once the investment recovers from the decline plus extra to make up for the loan interest & the limited sales during the decline, you can pay off the loan reducing or eliminating the penalty for the decline.

Additional thoughts:

  1. Currently, college saving accounts (529 & Coverdell Education Savings Account) cannot be used for paying off student loans. To enjoy this strategy, you should limit the amount of savings in these accounts. Notes:
    1. You can still use these accounts to pay for student loans that are used for current-year expenses.
    2. A bill (H.R.529 – 529 and ABLE Account Improvement Act of 2017) was introduced in January 2017 to allow use of the account to pay for student loans, but it is just in the proposal phase.
  2. There are additional reasons to limit the use of college savings accounts, despite the tax benefits. Saving too much can happen for numerous reasons:
    1. High investment growth.
    2. Lower college costs, e.g. through proliferation of online (or partly online) programs.
    3. Getting a large scholarship.
    4. Going for a cheaper university than the parents planned for (e.g. an in-state college).
    5. Skipping college altogether, and starting a business.
  3. You can benefit from maximizing a Coverdell ESA (Coverdell Education Savings Account) before using 529, for several reasons:
    1. Nearly unlimited investment choices, just like IRAs, allowing for more optimal growth, when given to the right hands.
    2. Unlike 529, the money can be used for grade-school expenses. This can help in case of saving too much.
  4. You can benefit from avoiding 529 altogether. The Coverdell ESA account is limited to $2,000 contribution per year, which significantly reduces the risk of overshooting the saving amount, especially if (but not limited to) you end up taking temporary student loans.
  5. This plan does not get in the way of you gifting the college expenses: you can gift the loan payments. If done right, you are likely to end up with a lower cost regardless of your luck with the investments, as long as you hold onto the loans until the investments go through enough of the up years of the cycle.
  6. Another consideration: the more college years you expect, the lower the overall negative impact of declines, even without the help of temporary student loans. For example, if you have 2 children, 2 years apart, and each studies for 4 years, the expense is spread over 6 years.

Quiz Answer:

What is the most powerful way to maximize the value of your college savings?

  1. Include increasing amounts of bonds and cash, reaching 100% as your child reaches 18, to minimize the chance of losses due to stock declines.
  2. Maximize 529 plan contributions – while returns are unknown, tax savings are a guarantee.
  3. Allocate 100% of the savings to stocks, and be prepared to take temporary student loans in case of a stock decline during college years. [The Correct Answer]
  4. Create a balanced allocation of stocks & bonds, while maximizing the tax benefits of college saving plans, including both 529 & Coverdell ESA.

Explanation:

  1. While bonds and cash reduce the downside, they also limit the upside. There is a way to limit the downside without this sacrifice (see the correct answer, #3).
  2. There are two problems with this solution: (1) You can over-save, resulting in a 10% penalty on the excess + income tax on the gains on the excess, if you can’t find a family member that under-saved; (2) 529 plans have limited investment options with a drag on returns that may be greater than the entire tax benefit.
  3. This optimizes the growth combining the following: (1) fast growing stocks; (2) moderating or completely reverting downturns by spreading the withdrawals over many years, in case of a decline in college years.
  4. See #1 & #2 above.
Disclosures Including Backtested Performance Data

Why do Investors Love Large U.S. Stocks?

Investors in the U.S. typically have a strong bias towards buying Large U.S. Stocks. This article discusses some reasons for this bias, with their benefits and costs.

Here are some reasons for buying Large U.S. Growth (high price to book value) stocks:

  • Low Risk . This group of companies is the most stable in the world. They are located in the most developed country in the world, and have very large markets to their products and services. If you were to pick a single stock to invest in, a Large U.S. stock would be a conservative choice, relative to other stocks.
  • Home Bias . Investors feel comfortable investing in companies geographically closer to them.
  • Familiarity Bias . Investors feel comfortable investing in names they hear often. Historically this made more sense, when information traveled slowly, and for people who analyzed individual stocks.
  • Costs . It is cheapest to buy these stocks, in terms of bid-ask spread. This trading cost can reach several percent of the stock price, and historically was even higher, making it a big factor to consider when trading frequently.
  • Tradition Bias . Investors are afraid of change. Some of the reasons listed above were good reasons for people to buy these stocks in the past. People feel comfortable sticking to approaches that worked in the past, even if they are no longer the correct ones.

As explained above, Large U.S. stocks made sense at times when trades were very expensive, and there were no options to cheaply invest in highly diversified portfolios, with very low turnover . Today, assuming you are not a speculator that happened to believe in a certain Large U.S. stock, there is only one reason to invest in such stocks: diversification.

The group of Large U.S. stocks is the least volatile, and has less than perfect correlation with other groups of stocks. These characteristics make it a good addition to a portfolio to reduce its volatility. Given that the returns of this group are the worst of all groups of stocks, in some cases by a wide margin, it makes sense to limit the allocation to this group. Greater allocations should be made to small stocks, international stocks and emerging markets stocks. It may feel riskier to limit the allocation to the safest stock class, but it is not. A highly diversified portfolio of large and small stocks around the world is a lot less volatile than a portfolio concentrated in Large U.S. stocks. See “Can the S&P 500 be dangerous?” (Hanoch, Apr. 2005) for a demonstration of this concept.

Summary

There are many reasons for investors to love Large U.S. stocks, and almost none of them makes financial sense for a conservative investor. The one good reason to hold such stocks is to diversify a global stock portfolio.

Turnover = the percent of the portfolio that is being sold each year. Low turnover means low trading costs. Mutual funds that represent a wide asset class with no market timing or individual stock selection tend to have very low turnover.

Disclosures Including Backtested Performance Data

Has Stock Diversification Failed?

During 2008 and 2009, some claimed that diversification of stock investments is no longer beneficial, and, consequently, that we should look elsewhere to reduce our investment risks. This article assesses these claims, and demonstrates, through analysis, the benefits of diversification, even in the face of the 2008 decline. More specifically, it will discuss the potential benefit of adding small, international and emerging markets stocks, to help diversify the typical US centric portfolio.

What seemed wrong with Stock Diversification in 2008? During the market decline of 2008 all stock classes declined substantially. Adding small, international and emerging markets stocks, not only did not help a U.S. centric portfolio, but even aggravated the decline, leading to a lower bottom. This can be seen in the graph below, comparing the globally diversified portfolio Long-Term Component with the S&P 500 in 2008-2009.

2010-04 Has Diversification Failed_image001

This result may lead you to believe that stock diversification failed.

If you redeemed your entire investment after these two years, stock diversification would not have helped you. However, a two-year investment should not be put into any stock portfolio.

Appropriate usages of stock investments include:

  1. Long-Term Growth
  2. Immediate retirement income, as long as withdrawals are limited to a small percentage every year1.

Contrary to Some Claims, Global Diversification of Stocks was Successful . If we expand the period of comparison by two additional years, starting in 2006, we get improved results, thanks to higher returns surrounding the decline. Diversification provided substantially improved security, flipping the total returns to positive, with a total difference of 24%.

2010-04 Has Diversification Failed_image002

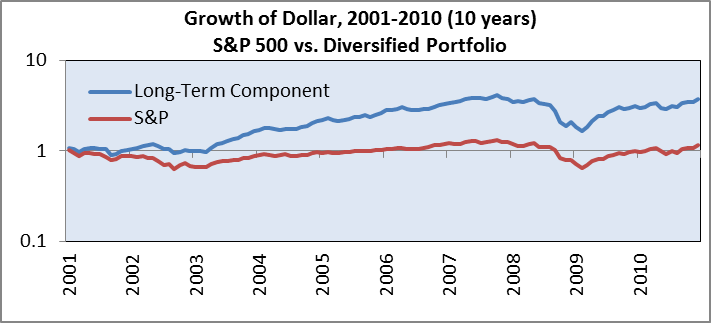
If we further expand the comparison to the 10 years 2001-2010, we get a striking difference greater than 200%.

2010-04 Has Diversification Failed_image003

While the correlation between the portfolios seems relatively high, the diversified portfolio provided substantially better results. Two factors helped, as can be seen in the graph above:

  1. In early 2002 there were several months in which the diversified portfolio gained, while S&P 500 declined. These few months were enough to have the diversified portfolio recover from the early 2000’s recession very quickly and have a lasting impact until today.
  2. In 2003-2007 the diversified portfolio had faster overall growth, providing a result 3 times larger (200% higher) than the S&P 500. So, while the S&P 500 stayed at levels below the level of 10 years ago for a long period, the diversified portfolio maintained nice gains throughout the entire 2008 decline.

To judge whether diversification is beneficial, we should do two things:

  1. Compare the length of declines, in addition to the depth. In the middle graph (4 years), you can see that, thanks to the higher 2009 returns, the recovery above the 2006 level occurred many months earlier.
  2. Expect diversification to provide some moderation or shortening of declines, but not eliminate severe declines altogether. Given that diversifying a U.S. Large centric stock portfolio does not hurt the long-term returns (it actually increases them), it would make sense to diversify even without any risk-reduction benefit. Not only is there a risk reduction benefit, it occurs in most declines and tends to be substantial.

To further demonstrate the benefits of stock diversification, a table is provided, comparing the diversified stock portfolio to the S&P 500 over different horizons, all relevant for a retiree looking for current income:

Annual Returns: S&P 500 vs. Diversified Stock Portfolio (Long-Term Component)
Calendar Years S&P 500 Long-Term Component Annual Benefit
2007-2009 3 -5.6% -2.2% +3.4%
2005-2009 5 0.4% 7.7% +7.3%
2001-2010 10 1.4% 14.3% +12.4%

Summary

Despite claims to the contrary, stock diversification still holds, and is beneficial through declines, including the great 2008 decline. Diversification may help shorten tough declines and/or make them shallower. In some cases, the benefit appears before and/or after the decline, still providing a great benefit to the long-term investor as well as the retiree that depends on current income.

1 3%-4% is a common range, depending on the portfolio

Disclosures Including Backtested Performance Data

Can Increased Risk be Conservative?

[Updated Data February, 2011]

This article provides important guidance for conservative investors. It is especially important for retirees with limited or no sources of new income.

It is a common belief that as a conservative investor, you should put your money in some of the most stable companies in the world: the largest stocks in the US . Many people go one step further, diversify and hold 500 of these through an S&P 500 Index fund, in order to reduce the risks specific to any particular company. In addition, some hold onto them for the long run, and avoid the big risk of buying or selling at the wrong time.

Is this a conservative approach?

This approach reduces many of the risks investors face today, but you can do much better! You probably heard that if you can afford to take higher risks you may benefit from higher returns by holding stocks of small and international companies. These companies are indeed riskier than the companies in the S&P 500, but if you hold them together in one portfolio, you may reduce your total risks.

Can this work in real life?

Yes, the Long-Term Component by QAM is an example of a portfolio that holds thousands of companies, some very risky when observed individually, and is significantly more conservative than the S&P 500.

Let’s look at the 2000-2002 recession and recovery periods for the S&P 500 and Long-Term Component.

2006-03 Can Increased Risk be Conservative_clip_image002

The following table summarizes certain differences between the portfolios:

  S&P 500 Long-Term Component
Recession max decline -45% -20%
20% decline duration 39 months 1 month
Recession to recovery period 6 years 1 month 2 years 4 months
Returns from bottom to 12/2007 98% 321%

All measures are striking and especially notable is the recession to recovery period. It took 6 years for the S&P 500 to recover, compared to 2 years for the diversified portfolio.

Why does this work?

The change in value of a portfolio is a result of the combined changes of its components. During the recession period, many companies in both portfolios declined significantly. Some went bankrupt. The key to the Long-Term Component’s success was lower correlation between the prices of the stocks in it.

All companies in the S&P 500 are subject to the same risks common to large companies in the US . The decline in the US affected 100% of the portfolio. The long-Term Component is diversified in nearly 40 countries around the world, including large and small companies. Small companies tend to better diversify since they serve more local markets and are less affected by global events.

Even small differences in the timing of recessions around the world, reduces the duration and magnitude of declines in the portfolio. The following example demonstrates this principle:

Imagine two portfolios that each had the same returns with a 1 year offset between the two, a 2 year recession and a total decline of -14%. The following table shows the portfolio returns each year.

Year 1 2 3 4
Portfolio 1 12% -10% -4% 6%
Portfolio 2 -10% -4% 6% 12%
Combined (equally) 1% -7% 1% 9%

When the portfolios were combined they had half the decline (7%) for half the duration (1 year), compared to the declines of each of the individual portfolios. This demonstrates how two portfolios with the same risk characteristics, but some difference in the timing of recessions, had much shorter and shallower declines, when combined together.

Reduce risk or increase returns?

Both! As demonstrated above, diversification can result in higher returns despite the lower risk. These high returns are a very nice benefit, but remember that the first priority of a conservative investor should be to limit the risk to acceptable levels. Only within these constraints you should try to maximize your returns. Diversification should be practiced even if the returns where not higher. The higher returns are a benefit of the diversification, not a reason for it.

To Summarize

Constructing a diversified portfolio that limits the risks to an acceptable level are a must for every investor, and especially for people with limited current income.

Any portfolio considered should be judged as a whole and without letting emotions get in the way. Risky stocks, having low correlation with an existing portfolio, make the portfolio more conservative, while low-risk stocks having high correlation with the portfolio do not reduce the risks.

To stay most conservative, you should include thousands of companies and avoid individual stock selection or market timing altogether (e.g. using index funds).

Disclosures Including Backtested Performance Data